EU Taxation: Highs and Lows
From the desk of George Adair on Sat, 2005-10-22 20:35
Press releases issued on Fridays are usually meant to be overlooked and forgotten going into the weekend. This press release from Eurostat [pdf] is probably no different, “EU25 overall tax burden at 40.3% of GDP in 2003.” This of course means that the equivalent of hundreds of billions of euros were taken from individuals and spent by government in 2003. Was some of this government spending efficient, of course. Was some of this governmental spending inefficient, absolutely.
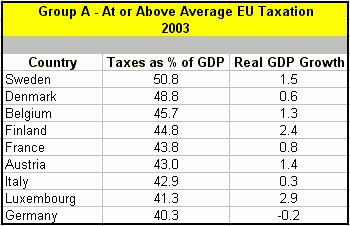
Did this level of government taxation have any bearing on the overall economic performance of the individual EU-25 countries, decide for yourself:

Source, Eurostat

Source, Eurostat
2003 was not an exciting year for overall EU-25 GDP growth, 1.1%. When taken as a whole, Group A represents 67% of the total EU-25 GDP, Group B represents 33% of the total EU-25 GDP. When it comes to EU-25 GDP growth for 2003, Group A was the source of 28% of EU-25 growth, Group B contributed 72% of the growth for 2003.
Causation and/or correlation, not from the above. Of note, certainly.
Fun with Stats: If the two groups were split into seperate economic blocs, Group A would have registered a GDP growth rate of .44% for 2003. Group B would have registered a GDP growth rate of 2.4% for 2003.

Growth and taxes
Submitted by Bob Doney on Mon, 2005-10-24 10:13.
Unfortunately the UK government - and especially Mr Brown, our Chancellor of the Exchequer and future Prime Minister - are determined to get us from Table B to Table A as quickly as possible. A quiet housing market, higher oil prices and enormous increases in the numbers of people working in the public sector should ensure we get there very soon.
Then we'll be good, illiberal Europeans like the rest of you.
Bob Doney